Set Analysis Graph Display Dialog Box
Prerequisites for use: An Analysis Graph tab is the active![]() The application, window, tab, or other screen element which is currently being used; sometimes called the "front" or "frontmost" screen element tab.
The application, window, tab, or other screen element which is currently being used; sometimes called the "front" or "frontmost" screen element tab.
Use: The Set Analysis Graph Display dialog box is used to define how the data is displayed in the active Analysis Graph tab.
Description: The various settings affect how data is displayed in the graph. Changes affect only the active Analysis Graph tab. If you want your changes applied to all future Analysis Graph tabs, click Use as Default.


Open the Set Analysis Graph Display Dialog BoxOpen the Set Analysis Graph Display Dialog Box
Do one of the following:
- Right-click anywhere on the Analysis graph and choose Set Graph Display from the shortcut menu
 Also known as a contextual menu, acessed by right-clicking (or pressing Ctrl+Click, Mac only) over a screen element that appears.
 - Press
 +
+ - On the Display menu, choose Set Graph Display.
Options in the Set Analysis Graph Display Dialog BoxOptions in the Set Analysis Graph Display Dialog Box
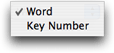
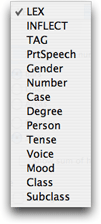
- Analysis class pop-up menu: Available items depend on the type of text that was searched. This setting defines the default class for analyzing search results, similar to the pop-up menu on the Analysis graph.
- For Key number texts, available options are Word or Key Number.
- If the text is not tagged, only Word is available, and this graph is useful only for wild-card searches.
- Grammatically tagged texts offer more items, including LEX, INFLECT, and TAG items, and the appropriate classes of parsing information. Examples of the Class pop-up menus that may appear are shown below.
![]()
- Graphic detail area: These options affect the graph content.
- The Words per hit box allows you to change the sample size of the frequency graph. You can enter any number between 100 and 10,000. An entry of 100 means that each bar represents the number of hits in the 100 words surrounding that point in the search range. A lower number shows more detail and is useful for smaller search ranges. A higher number is better for showing trends across the entire text.
- Display items: These items affect how the graph is drawn, and make the most difference when there are fewer sample points.
- Bars displays a vertical bar at each sample point.
- Lines draws a line connecting the sample points.
- Areas fills in the shape under the line.
- Superimpose as items: These items apply to display of multiple graphs.
- Overlay uses the same baseline for each graph with the oldest graph appearing behind newer graphs but still visible through the transparent colors.
- Stack creates a separate graph for each result, one above the other.
- Show sum of hits adds another graph with the totals of the graphs currently showing. This item can be selected with Stack or Overlay.
- Graph appearance area
- Show grid adds a light gray grid to the background.
- Use black background changes the graph background to black; this looks particularly good in presentations or a slide show.
- Graph colors area: Color pop-up menus let you customize the color of each displayed graph. Up to seven different graphs (and the sum of the hits) can be kept in the Graph tab at one time, with the color of each graph set by a numbered color pop-up menu item.
To change the color of one of the graphs, simply choose a new color from the corresponding pop-up menu.
|
Note The numbers beside the color pop-up menus refer to the current number of each graph. Therefore if you have two graphs showing, and you clear the first (earliest) graph, the color of the second graph changes to the color of the first pop-up menu setting. |