Analysis Graph
The Analysis Graph is similar to the Hits Graph as it displays hits across the search range. However, instead of allowing addition of other searches, it breaks down the results of a single search. You can click on any bar of the graph to view the hit text in the Search tab![]() The core tab used to search Bible texts, it consists of a search entry area and a search results area.
The core tab used to search Bible texts, it consists of a search entry area and a search results area.
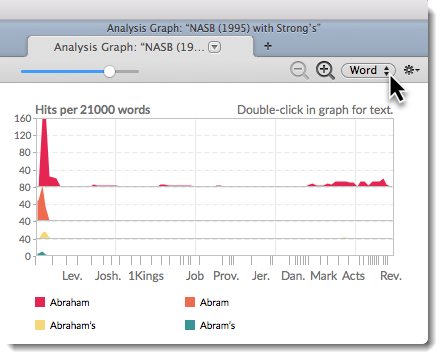
This example shows the results of a search for Abra*, broken down by Key number. Only the top seven items in the class are displayed.

Search ClassesSearch Classes
- Class pop-up menu (top right): Click to choose a different class to analyze. The example below shows the same search above broken down by the words found.
 For Key number texts, available options are Word or Key Number.
- If the text is not tagged, only Word is available, and this graph is useful only for wild-card searches.
- Grammatically tagged texts offer more items, similar to those in the Analysis tab, except that here you can select only one class. This pop-up menu shows the classes available for Hebrew texts.
- To remove a specific search from the graph, move the cursor over one of the search labels until an X appears, and then click the search label.
This example shows a search for words from the root![]() A root is a unit of a language that cannot be further divided, from which words are derived by modification. The root does not necessarily survive as a word in itself. The Accordance roots may combine homographs and therefore a single root may include roots with different etymologies and meanings. In Hebrew, by convention, the lexical form (lemma) of a verb is the same as the root. agape broken down by the inflected form
A root is a unit of a language that cannot be further divided, from which words are derived by modification. The root does not necessarily survive as a word in itself. The Accordance roots may combine homographs and therefore a single root may include roots with different etymologies and meanings. In Hebrew, by convention, the lexical form (lemma) of a verb is the same as the root. agape broken down by the inflected form![]() The word as it appears in the original text, which may be modified from its base dictionary form (INFLECT).
The word as it appears in the original text, which may be modified from its base dictionary form (INFLECT).

Graph SettingsGraph Settings
You can change the default display of the graph.
|
Note Click on the zoom buttons ( |
 ) to decrease and increase the magnification level of the graph. Click-and-hold to pan through a graph.
- Right-click within the Analysis graph and choose Set Graph Display. The Set Analysis Graph Display dialog box appears.
You can also use the Action pop-up menu ( ) to access this and other items.
- Change the settings as desired. You can choose:
- the default analysis class.
- the density of hits.
- to display as bars, lines or areas.
- to superimpose or stack the graphs.
- to show the sum of the search hits.
- a black or white background, with or without a grid.
- the color of each graph.