Analysis Pie Chart
The Analysis Pie Chart presents the same information as in the Analysis Bar Chart, but as the familiar Pie Chart.
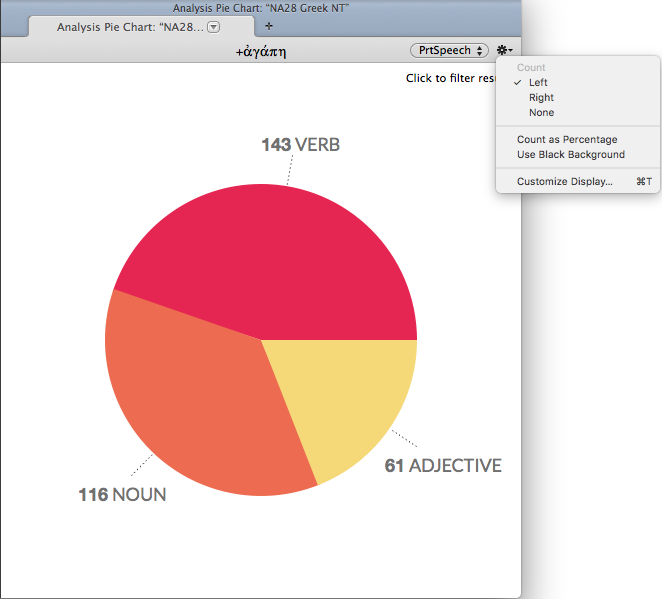
This example shows the results of searches for agape in the Greek New Testament, broken down by Part of Speech.
Understanding the Analysis Pie ChartUnderstanding the Analysis Pie Chart
- Each "slice" is labeled with a name and number count. Only a limited number of items in a class can be shown.
- The text at the top of the Pie Chart tab displays the search argument.
- Class pop-up menu (top right): Used to choose a different class to analyze.
- The Action menu (
 ) provides access to additional items.
 - Count options: The word total labels can be placed to the left or right of the word, or removed from the display.
- Count as Percentage: The word total labels are viewed as a percentage of the total.
- Use Black Background: The Pie Chart background is displayed as black, instead of white.
- Customize Display...: Opens the Set Analysis Pie Chart Display dialog box.
- Click on a specific slice to display the following analyses:
- Key Number text: Click a specific slice to display an analysis of that word.
- If the Analysis Pie Chart tab is displaying results by Key Number, clicking a slice displays the ways in which that original language word is translated in the original search text.
- If the Analysis Pie Chart tab is displaying results by Word, clicking a slice displays all the original language words that are translated by that form.
- Grammatically Tagged Original Language text: Click a result to display an analysis of the specific word or grammatical form.
- Click a result in a Grammatically Tagged text to display the forms of the selected word, as specified in the Class pop-up menu.
The example below shows the results of a search for Love in the Old Testament (in the ESV, an English Key Number Text). Clicking the chesed slice of the chart (the cursor changes to a magnifying glass) in the Analysis Pie Chart tab displays the ways the word is translated in the ESV. Click Prior Results (top left of the tab) to return to the original pie chart.

Shift-click an item in the Pie Chart tab to perform a search for that item. In this example, shift-clicking on chesed in the Analysis Pie Chart tab opens a new Search tab![]() The core tab used to search Bible texts, it consists of a search entry area and a search results area, displaying the results of the search.
The core tab used to search Bible texts, it consists of a search entry area and a search results area, displaying the results of the search.

SettingsSettings
You can change the default display of the Pie Chart.
- Right-click in the Analysis Pie Chart tab and choose Set Graph Display. The Set Analysis Pie Chart Display dialog box appears.
- Change the settings as desired. You can choose:
- the default analysis class.
- the position of the count label.
- display of the percentage of hits or total number of hits.
- black or white background.
- the color of each slice.