Hits Graph
The Hits graph displays the density of hits across the search range. It is used to identify overall trends in the search results.
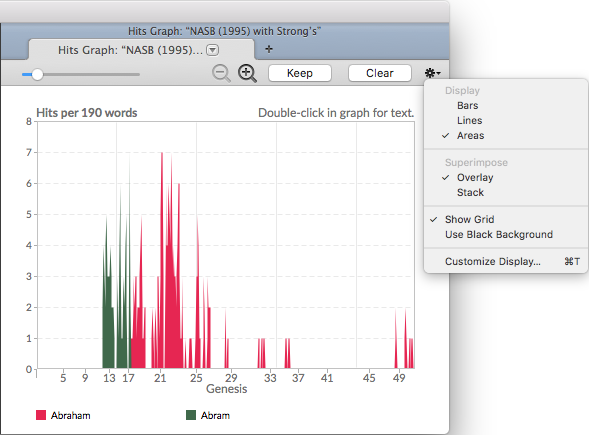
This example shows the results of two searches for different names for Abraham in Genesis.
The Hits Graph TabThe Hits Graph Tab
The Hits Graph tab is tied to the Search tab![]() The core tab used to search Bible texts, it consists of a search entry area and a search results area. Double-click anywhere inside the graph frame to scroll to the corresponding location in the search results text pane.
The core tab used to search Bible texts, it consists of a search entry area and a search results area. Double-click anywhere inside the graph frame to scroll to the corresponding location in the search results text pane.
- Vertical axis: Number of hits
- Horizontal axis: Search range
- Legend (below graph): Search argument for each graph
- Click on the zoom buttons (
 ) to decrease and increase the magnification level of the graph. Click-and-hold to pan through a graph.
|
Note This and other Analytics tabs which display results across the range of the search use the range as set in the Range pop-up menu. A vertical line marks a break in a non-contiguous range. If the RANGE command is given in the Search Entry box, the results are limited to the command but displayed with the range defined in the menu. |
Multiple searchesMultiple searches
- You can superimpose up to seven graphs in the same tab, each graph with results of a different search in a different color.
- Keep: Click to keep the current graph in the tab, the next time a search is performed in the associated Search tab; the new graph is superimposed on the current graph.
- Keep is dimmed after you click it, indicating this graph has been saved.
- The first time you click Keep, a reminder appears, advising the graph will be kept only if the search text and range are not changed for the subsequent search.
- Clear: This button is dimmed unless there are two or more graphs in the tab. Click Clear to remove background graphs, leaving only the results of the current search.
- Shortcuts to Add/Remove Search Results
- To keep the current graph and add the new one, enter the desired search argument in the Search Entry box and press Shift+Enter.
- To remove a specific search from the graph, move the cursor over one of the search labels in the legend until an X appears, and then click the label.
SettingsSettings
You can change the default display of the graph.
- Right-click within the Hits graph and choose Set Graph Display. The Set Hits Graph Display dialog box appears.
You can also use the Action pop-up menu ( ) to access this and other items.
- Change the settings as desired. You can choose:
- the density of hits.
- to display as bars, lines or areas.
- to superimpose or stack the graphs.
- to show the sum of the search hits.
- black or white background, with or without a grid.
- the color of each graph.
The picture below shows the same graph at the beginning of this topic, but with different display settings.
