Table Bar Chart
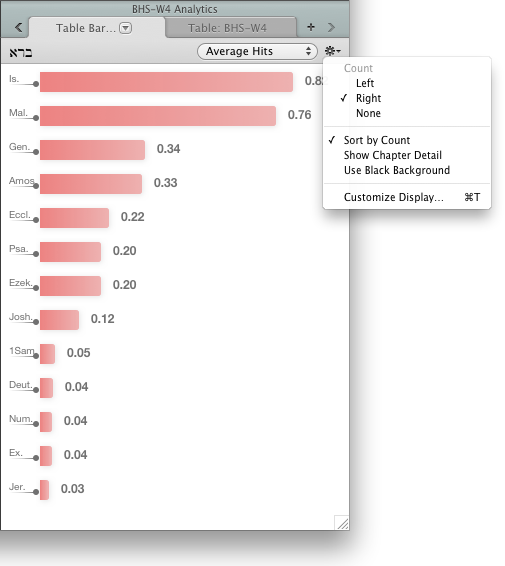
The Table Bar Chart graphically presents the information presented in the Table details.
This example shows the total hits in each book, for the search for bara in the Hebrew Bible.

- Each bar is labeled with the book or chapter and the count.
- The legend below the graph displays the search argument.
- Display pop-up menu (top right): Used to choose what is counted. You can choose from:
- Average Hits
- Total Hits
- Total Words
- Total Verses
- Up to 128 bars can be displayed at once, in up to 4 columns.
- The Action pop-up menu (
 ) provides access to additional items.
You can change the default display of the Table Bar Chart.
- Right-click on the Table Bar Chart and choose Set Graph Display. The Set Table Bar Chart Display dialog box appears.
- Change the settings as desired. You can choose:
- display of total hits, average hits, total words, or total verses.
- the position of the count label.
- the order of the bars (book order or count).
- chapter detail or whole books.
- black or white background.
- the color of each bar.