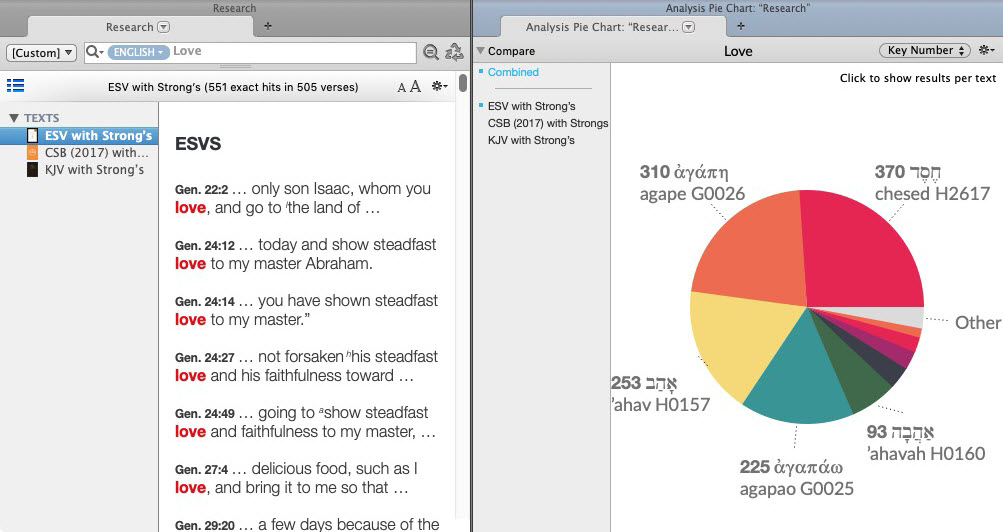
Research Analysis Pie Chart
The Research Analysis Pie Chart presents the same information as in the Research Analysis Bar Chart, but as the familiar Pie Chart.

- Each "slice" is labeled with a name and number count. Only a limited number of items in a class can be shown.
- The legend below the graph displays the search argument.
- Class pop-up menu (top right): Used to choose a different class to analyze.
- The Action menu (
 ) provides access to additional items.
 - Count options: The word total labels can be placed to the left or right of the word, or removed from the display.
- Count as Percentage: The word total labels are viewed as a percentage of the total.
- Use Black Background: The Pie Chart background is displayed as black, instead of white.
- Customize Display...: Opens the Set Analysis Pie Chart Display dialog box.
You can change the default display of the Pie Chart.
- Right-click on the Pie Chart and choose Set Graph Display. The Set Analysis Pie Chart Display dialog box appears.
- Change the settings as desired. You can choose:
- the default analysis class.
- the position of the count label.
- display of the percentage of hits or total number of hits.
- black or white background.
- the color of each slice.